Table of Contents
The Line of Best Fit Calculator is a free online tool that displays scatter plots for the given data points. STUDYQUERIES’ online line of best-fit calculator tool makes the calculation faster and displays the line graph in a matter of seconds.
How to Use the Line of Best Fit Calculator?
To use the line of best-fit calculator, follow these steps:
Step 1: Enter the data points separated by a comma in the respective input field.
Step 2: Now click the button “Calculate Line of Best Fit” to get the line graph.
Step 3: Finally, the straight line that represents the best data on the scatter plot will be displayed in the new window.
Line of Best Fit Calculator
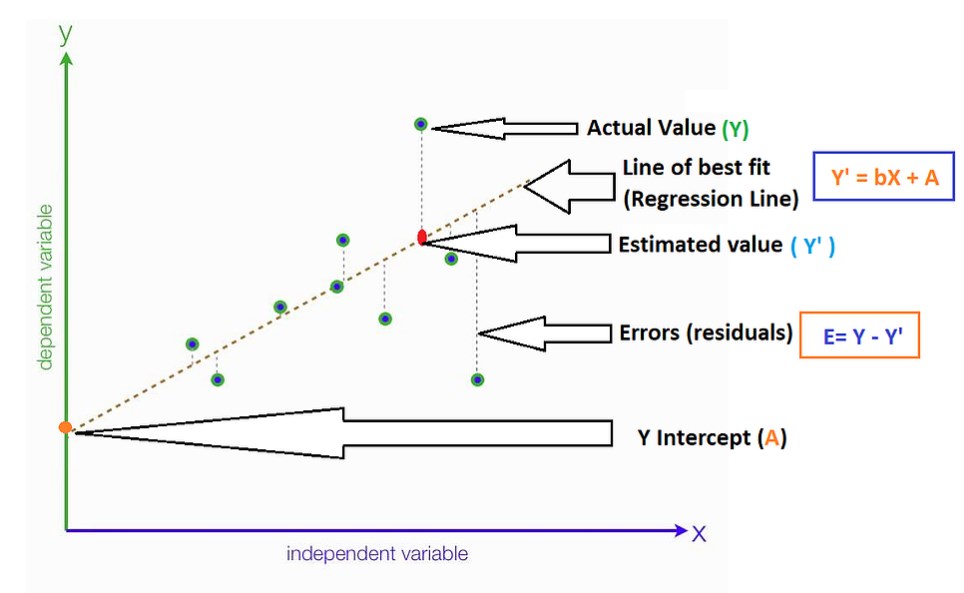
What is the Line Of Best Fit?
There is a line through a scatter plot of data points that best expresses the relationship between them. Either by hand calculations or by using regression analysis software, statisticians arrive at the geometric equation for the line using the least-squares method. From a simple linear regression analysis of two or more independent variables, a straight line will result. When multiple related variables are included in a regression, a curved line can appear.
Basics of Line Of Best Fit
Among the most important outputs of regression analysis is the line of best fit. R is a measure of the relationship between one or more independent variables and a resulting dependent variable. Professionals in many fields use regression, from science and public service to financial analysis.
During a regression analysis, a statistician collects a collection of data points, each including a set of dependent and independent variables. The dependent variable could be the stock price of a company, and the independent variables could be the Standard and Poor’s 500 indexes and the national unemployment rate, assuming that the stock is not part of the S&P 500. For the past 20 years, each of these three data sets could be sampled.
On a chart, these data points would appear as scatter plots, a group of points that may or may not be arranged along any lines. In case a linear pattern is apparent, it may be possible to sketch a line of best fit that minimizes the distance between those points and the line. In the absence of an organizing axis, regression analysis can generate a line using least-squares. By minimizing the squared distance between each point and the line of best fit, this method builds the line.
Read Also – Detailed Information Of Pie Charts and Its Properties
A statistician inputs these three results for the past 20 years into a regression software program to determine the formula for this line. In order to calculate the causal relationship between the S&P 500, the unemployment rate, and the stock price of the company, the software produces a linear formula. This formula corresponds to the line of best fit. Analysts and traders can use it to forecast the stock price of a firm based on two independent variables.
The Line of Best Fit Equation and Its Components
A regression with two independent variables such as the example discussed above will produce a formula with this basic structure:
$$y= c + b_1(x_1) + b_2(x_2)$$
Y is the dependent variable, c is a constant, b1 is the first regression coefficient, and x1 is the first independent variable. b2 is the second coefficient, and x2 is the second independent variable. From the above example, the stock price would be y, the S&P 500 would be x1, and the unemployment rate would be x2. With each additional unit of the independent variable, the coefficient of that variable represents the degree of change in y.
An S&P 500 increase by one will result in a corresponding increase in share price equal to the coefficient. A higher unemployment rate will also result in a higher share price. The coefficient of a simple regression with one independent variable is the slope of the line of best fit. Any regression with two independent variables has a slope that is a mixture of the two coefficients. Constant c is the y-intercept of the line of best fit.
NOTE:
- The Line of Best Fit is used to express a relationship in a scatter plot of different data points.
- It is an output of regression analysis and can be used as a prediction tool for indicators and price movements.
Line of Best Fit (Least Square Method)
The best fit line is a straight line that approximates the given set of data as closely as possible.
It is used to examine the nature of the relationship between two variables. (We are only considering the two-dimensional case.)
With an eyeball method, a line of best fit can be roughly determined by drawing a straight line on a scatter plot so that the number of points above and below the line is equal (and the line passes through as many points as possible).
The least squares method is a more accurate way to determine the line of best fit.
Use the following steps to find the equation of the line of best fit for a set of ordered pairs $$(x_1,y_1),(x_2,y_2),…(x_n,y_n)$$
Step 1: Calculate the mean of the x -values and the mean of the y -values.
$$\bar{X}=\frac{\sum_{i=1}^{n}X_i}{n}$$
$$\bar{Y}=\frac{\sum_{i=1}^{n}Y_i}{n}$$
Step 2: The following formula gives the slope of the line of best fit:
$$m=\sum_{i=1}^{n}(X_i-\bar{X})(Y_i-\bar{Y})$$
$$m=\sum_{i=1}^{n}(X_i-\bar{X})^2$$
Step 3: Compute the y-intercept of the line by using the formula:
$$b=\bar{Y}-m\bar{X}$$
Step 4: Use the slope m and the y-intercept b to form the equation of the line.
Example:
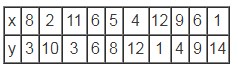
Use the least square method to determine the equation of the line of best fit for the data. Then plot the line.
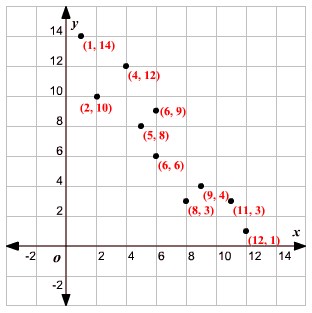
Solution: Plot the points on a coordinate plane.
Calculate the means of the x -values and the y -values.
$$\bar{X}=\frac{\sum_{i=1}^{10}X_i}{10}=\frac{8+2+11+6+5+4+12+9+6+1}{10}=6.4$$
$$\bar{Y}=\frac{\sum_{i=1}^{10}Y_i}{10}=\frac{3+10+3+6+8+12+1+4+9+14}{10}=7$$
$$Now\ calculate\ X_i-\bar{X} , Y_i-\bar{Y} , (X_i-\bar{X})(Y_i-\bar{Y}) , and\ (X_i-\bar{X})^2\ for\ each\ i$$
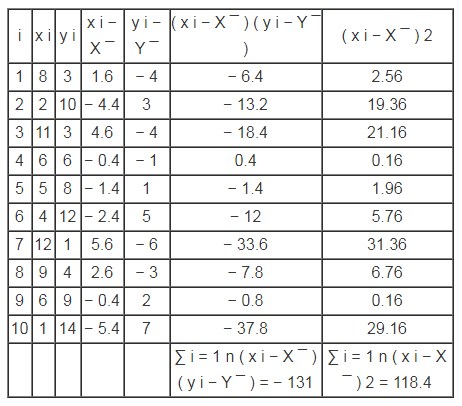
$$m=\sum_{i=1}^{10}(X_i-\bar{X})(Y_i-\bar{Y})=\sum_{i=1}^{10}(X_i-\bar{X})^2=\frac{-131}{118.4}\approx-1.1$$
Calculate the y -intercept.
Use the formula to compute the y-intercept.
$$b=\bar{Y}-m\bar{X}=7-(-1.1\times6.4)\approx14.0$$
Use the slope and y-intercept to form the equation of the line of best fit.
The slope of the line is −1.1 and the y-intercept is 14.0.
Therefore, the equation is $$y=−1.1x+14.0$$
Draw the line on the scatter plot.
Correlation Coefficients
The correlation coefficient measures the “goodness of fit” of the best fit line (least-squares line). The correlation coefficient indicates the measure of linear association between two variables, as well as whether the correlation is positive or negative. It ranges between -1 and 1, inclusive.
A correlation coefficient, designated by r, is a number in the range -1 < r < 1, which indicates how well a regression equation truly represents the data being examined.
- If r is close to 1 (or -1), the model is considered a “good fit”.
- If r is close to 0, the model is “not a good fit”.
- If r = ±1, the model is a “perfect fit” with all data points lying on the line.
- If r = 0, there is no linear relationship between the two variables.
A correlation greater than 0.8 is generally described as strong, whereas a correlation less than 0.5 is generally described as weak. These values can vary based upon the “type” of data being examined. A study utilizing scientific data may require a stronger correlation than a study using social science data.
Line Of Best Fit Equation Calculator:
A Line of Best Fit Equation Calculator is a tool that helps determine the equation for the line that best fits a given set of data points. It uses statistical techniques to find the line that minimizes the distance between the line and the data points. The equation for the line is typically represented as y = mx + b, where m is the slope of the line and b is the y-intercept.
Example:
Suppose we have a set of data points: (1, 2), (2, 4), (3, 6), (4, 8), and (5, 10). Using a Line of Best Fit Equation Calculator, we can find the equation for the line that best fits these data points. The resulting equation might be y = 2x, indicating that the line has a slope of 2 and a y-intercept of 0.
Solution using related entities:
To calculate the line of best fit equation, you can use statistical software packages like Excel, Python (with libraries such as NumPy and SciPy), or online calculators. These tools utilize regression analysis to determine the equation that best represents the relationship between the variables.
Line Of Best Fit Calculator With Steps:
A Line of Best Fit Calculator with Steps is a tool that not only provides the equation for the line of best fit but also shows the step-by-step process of how the calculation is performed. It helps users understand and replicate the calculation process.
Example:
Using the same set of data points as mentioned above, a Line of Best Fit Calculator with Steps would show the detailed calculations involved in determining the equation y = 2x.
Solution using related entities:
To create a Line of Best Fit Calculator with Steps, you would need to program the calculator to perform the following steps:
– Calculate the means of the x and y values.
– Calculate the differences between each x value and the mean of x, and between each y value and the mean of y.
– Calculate the product of these differences for each data point.
– Calculate the squared differences between x values and the mean of x.
– Calculate the slope of the line by dividing the sum of the product of differences by the sum of squared differences.
– Calculate the y-intercept by substituting the slope and the means of x and y into the equation y = mx + b.
Exponential Line Of Best Fit Calculator:
An Exponential Line of Best Fit Calculator is a tool specifically designed to find the best-fitting exponential function for a given set of data points. Unlike a linear line of best fit, which represents a straight line, an exponential line of best fit represents a curve that follows an exponential growth or decay pattern.
Example:
Suppose we have a set of data points: (1, 2), (2, 4), (3, 8), (4, 16), and (5, 32). Using an Exponential Line of Best Fit Calculator, we can determine the equation for the exponential curve that best fits these points. The resulting equation might be y = 2^x, indicating exponential growth with a base of 2.
Solution using related entities:
To calculate the exponential line of best fit, you can utilize statistical software or programming languages that support exponential regression analysis. Tools like Excel, Python (using libraries such as NumPy, SciPy, or scikit-learn), or online calculators can provide the equation of the best-fitting exponential curve.
Line Of Best Fit Graphing Calculator Online:
A Line of Best Fit Graphing Calculator Online is a web-based tool that not only calculates the line of best fit but also generates a graph displaying the data points and the fitted line. It provides a visual representation of the relationship between the variables.
Example:
Suppose we have a set of data points: (1, 2), (2, 4), (3, 6), (4, 8), and (5, 10). Using a Line of Best Fit Graphing Calculator Online, we can enter these points, and the tool will generate a graph showing the data points as well as the line of best fit.
Solution using related entities:
To create a Line of Best Fit Graphing Calculator Online, you would need to incorporate graphing capabilities into the calculator. This can be achieved by using JavaScript libraries such as D3.js, Chart.js, or Plotly.js, which allow you to plot the data points and the line of best fit on a web page.
How To Find The Line Of Best Fit On A Calculator:
Finding the line of best fit on a calculator involves using the built-in statistical functions of the calculator to perform regression analysis. The exact steps may vary depending on the calculator model, but generally, you would input the data points and follow the calculator’s instructions to obtain the line of best fit equation.
Example:
Let’s say you have a scientific calculator that supports regression analysis. You would enter the x-values and y-values into the calculator and access the regression function. The calculator would then calculate the line of best fit equation, providing you with the slope, y-intercept, and possibly the correlation coefficient.
Solution using related entities:
To find the line of best fit on a calculator, you would typically use calculators with regression analysis capabilities, such as scientific calculators or graphing calculators. These calculators often have dedicated buttons or functions for performing linear regression, allowing you to input the data points and obtain the line of best fit equation.
Line Of Best Fit Equation:
The Line of Best Fit Equation represents the mathematical relationship between the independent variable (x) and the dependent variable (y) that best fits a given set of data points. It is typically represented in the form y = mx + b, where m is the slope of the line and b is the y-intercept.
Example:
Suppose we have a line of best fit equation y = 2x + 1. This equation indicates that for every increase in the x-value by 1, the corresponding y-value increases by 2. The y-intercept of 1 indicates that the line intersects the y-axis at the point (0, 1).
Solution using related entities:
To obtain the line of best fit equation, you can use statistical software packages like Excel, Python (with libraries such as NumPy and SciPy), or online calculators. These tools perform regression analysis on the given data points and provide the equation that best represents the relationship between the variables.
Line Of Best Fit Calculator With Steps:
A Line of Best Fit Calculator with Steps not only calculates the line of best fit but also provides a step-by-step breakdown of the calculations involved. It helps users understand the process and replicate it manually if needed.
Example:
Suppose we have a set of data points: (1, 2), (2, 4), (3, 6), (4, 8), and (5, 10). A Line of Best Fit Calculator with Steps would show the detailed calculations, such as calculating the means of x and y, finding the differences between each data point and the means, calculating the product of differences, calculating the squared differences, and ultimately deriving the equation y = 2x.
Solution using related entities:
To create a Line of Best Fit Calculator with Steps, you would need to program the calculator to perform the calculations involved in determining the line of best fit. The steps include calculating means, differences, products, squared differences, slope, and y-intercept. These calculations can be implemented
using programming languages like Python, JavaScript, or using spreadsheet software like Excel.
Line Of Best Fit Graph Generator:
A Line of Best Fit Graph Generator is a tool that generates a graph representing the data points and the line of best fit. It provides a visual representation of how well the line fits the data and helps identify any trends or patterns.
Example:
Suppose we have a set of data points: (1, 2), (2, 4), (3, 6), (4, 8), and (5, 10). A Line of Best Fit Graph Generator would plot these points on a graph and display the line of best fit that minimizes the distance between the line and the data points.
Solution using related entities:
To create a Line of Best Fit Graph Generator, you would need to incorporate graphing capabilities into the calculator or software. This can be achieved using programming languages and libraries such as Python (with Matplotlib or Plotly), JavaScript (with D3.js or Chart.js), or using graphing software like Excel.
Slope Of Line Of Best Fit Calculator:
A Slope of Line of Best Fit Calculator is a tool specifically designed to calculate the slope of the line that best fits a set of data points. The slope represents the rate of change of the dependent variable (y) with respect to the independent variable (x).
Example:
Suppose we have a set of data points: (1, 2), (2, 4), (3, 6), (4, 8), and (5, 10). A Slope of Line of Best Fit Calculator would calculate the slope of the line that minimizes the distance between the line and the data points, which in this case would be 2.
Solution using related entities:
To calculate the slope of the line of best fit, you can use statistical software, programming languages, or online calculators. These tools perform regression analysis and provide the slope as part of the line of best fit equation.
Line Of Best Fit Calculator Y=Mx+B:
A Line of Best Fit Calculator using the equation y = mx + b allows users to calculate the equation for the line of best fit based on the given data points. It provides the values for m (slope) and b (y-intercept) in the equation.
Example:
Suppose we have a set of data points: (1, 2), (2, 4), (3, 6), (4, 8), and (5, 10). A Line of Best Fit Calculator using the equation y = mx + b would provide the values m = 2 (slope) and b = 0 (y-intercept) as part of the equation y = 2x + 0, which can be simplified to y = 2x.
Solution using related entities:
To calculate the line of best fit equation in the form y = mx + b, you can use statistical software packages like Excel, programming languages like Python (with libraries such as NumPy and SciPy), or online calculators. These tools perform regression analysis and provide the values of m and b that best represent the relationship between the variables.
Line Of Best Fit Calculator Ti-84:
The Line of Best Fit Calculator Ti-84 refers to the functionality available on the Texas Instruments TI-84 graphing calculator that allows users to calculate the line of best fit for a given set of data points. The TI-84 calculator is a widely used calculator in education and provides statistical functions, including regression analysis.
Solution using related entities:
To calculate the line of best fit using a TI-84 calculator, follow these general steps:
1. Enter the data points into lists on the calculator.
2. Access the statistical functions menu.
3. Choose the regression analysis function (often labeled “LinReg” or similar).
4. Specify the appropriate lists and variables.
5. The calculator will provide the line of best fit equation, including the slope, y-intercept, and correlation coefficient.
Line Of Best Fit Calculator With Correlation Coefficient:
A Line of Best Fit Calculator with Correlation Coefficient is a tool that calculates the line of best fit for a given set of data points and also provides the correlation coefficient, which measures the strength and direction of the linear relationship between the variables.
Solution using related entities:
To calculate the line of best fit with the correlation coefficient, you can use statistical software packages like Excel, programming languages like Python (with libraries such as NumPy and SciPy), or online calculators. These tools perform regression analysis and provide the line of best fit equation along with the correlation coefficient, giving insights into the strength of the relationship between the variables.
FAQs
How do you find the line of best fit?
An eyeball method can be used to determine a line of best fit by drawing a straight line on a scatter plot so that the number of points above and below the line is equal (and the line passes through as many points as possible).
What is the line of best fit also known as?
The line of best fit also called a trendline, is the line for which the sum of the squares of the residual errors between individual data values and the line is at its minimum, which is just a fancy way of saying it’s the straightest line that fits your data.
How do you find the line of best fit on Excel?
A dialog box will appear when you right-click on any of the data points. “Add Trendline”; this is what Excel calls a “best-fit line”. An options window appears where you can choose the type of Trend/Regression.
Does the line of best fit have to start at 0?
There is no need to go through the origin for the line of best fit. The line of best fit reveals the trend, but it is only approximate, so any readings derived from it are estimates.
Why is the regression line known as the line of best fit?
Because it is the line that fits best when drawn through the points, the regression line is sometimes called the “line of best fit.” The regression line minimizes the difference between actual and predicted scores.
How To Find The Line Of Best Fit On A Calculator?
To find the line of best fit on a calculator, follow these general steps:
1. Input the set of data points into your calculator.
2. Access the statistical functions or regression analysis feature on your calculator.
3. Select the appropriate regression model (linear regression) for finding the line of best fit.
4. Enter the variables or lists corresponding to the x and y values.
5. Calculate the regression equation, which will provide the slope and y-intercept of the line of best fit.
How To Make A Line Of Best Fit On A Graphing Calculator?
To make a line of best fit on a graphing calculator, you can follow these steps:
1. Enter the data points into your calculator.
2. Access the graphing capabilities of your calculator.
3. Plot the data points on the graph.
4. Utilize the regression analysis feature to calculate the line of best fit equation.
5. Plot the line of best fit on the same graph as the data points.
How To Find Line Of Best Fit Using Calculator?
To find the line of best fit using a calculator, perform the following steps:
1. Enter the data points into your calculator.
2. Access the statistical functions or regression analysis feature.
3. Choose the appropriate regression model for finding the line of best fit.
4. Enter the variables or lists representing the x and y values.
5. The calculator will provide the equation for the line of best fit, typically in the form of y = mx + b, where m is the slope and b is the y-intercept.
How To Use A Ti-84 Plus Texas Instruments Calculator To Find A Line Of Best Fit?
To use a TI-84 Plus Texas Instruments calculator to find a line of best fit, follow these steps:
1. Enter the data points into the calculator.
2. Access the statistical functions or regression analysis feature.
3. Choose the linear regression model for finding the line of best fit.
4. Specify the appropriate variables or lists for the x and y values.
5. The calculator will provide the equation of the line of best fit, including the slope and y-intercept.
How Do You Find The Equation Of The Line Of Best Fit In A Calculator?
To find the equation of the line of best fit in a calculator, follow these general steps:
1. Enter the data points into your calculator.
2. Access the statistical functions or regression analysis feature.
3. Select the appropriate regression model (linear regression) for finding the line of best fit.
4. Enter the variables or lists corresponding to the x and y values.
5. The calculator will provide the equation for the line of best fit, typically in the form of y = mx + b, where m is the slope and b is the y-intercept.
How Do You Calculate Best Fit Line?
To calculate the best fit line, you can use regression analysis techniques. Here are the steps:
1. Gather your data points.
2. Calculate the means (average) of the x and y values.
3. Calculate the differences between each x value and the mean of x, and the differences between each y value and the mean of y.
4. Calculate the product of these differences.
5. Calculate the squared differences for each x value.
6. Sum up the products and squared differences.
7. Calculate the slope of the line by dividing the sum of products by the sum of squared differences.
8. Calculate the y-intercept by using the mean values and the slope.
9. The resulting equation (y = mx + b) represents the best fit line.
How Is Line Of Best Fit Calculated In Linear Regression?
In linear regression, the line of best fit is calculated using mathematical formulas to minimize the distance between the line and the data points. The most common method is called the least squares method. Here’s a summary of the steps:
1. Gather your data points (x, y pairs).
2. Calculate the means (average) of the x and y values.
3. Calculate the differences between each x value and the mean of x, and the differences between each y value and the mean of y.
4. Calculate the product of these differences.
5. Calculate the squared differences for each x value.
6. Sum up the products and squared differences.
7. Calculate the slope of the line by dividing the sum of products by the sum of squared differences.
8. Calculate the y-intercept by using the mean values and the slope.
9. The resulting equation (y = mx + b) represents the line of best fit.
What Is The Line Of Fit On A Graph?
The line of fit on a graph, also known as the line of best fit, is a straight line that represents the most accurate approximation of the relationship between the x and y variables in a set of data points. It is determined by minimizing the overall distance between the line and the data points. The line of fit helps to identify any trends, patterns, or correlations within the data and can be used for making predictions or analyzing the relationship between the variables.